System Management Mode (SMM) is an x86 operating mode in which all normal execution, including the operating system, is suspended. SMM is of interest to cybersecurity specialists (black hat and white hat) because it can also be abused to run high-privileged rootkits. This week, I decided to use SourcePoint to explore some of its mysteries.
From Wikipedia:
SMM is entered via the SMI (system management interrupt), which is caused by:
- Motherboard hardware or chipset signaling via a designated pin SMI#of the processor chip. This signal can be an independent event.
- Software SMI triggered by the system software via an I/O access to a location considered special by the motherboard logic (port 0B2h is common).
- An I/O write to a location which the firmware has requested that the processor chip act on.
By entering SMM, the processor looks for the first instruction at the address SMBASE (SMBASE register content) + 8000H (by default 38000H), using registers CS = 3000H and EIP = 8000H. The CS register value (3000H) is due to the use of real mode memory addresses by the processor when in SMM. In this case, the CS is internally appended with 0H on its rightmost end.
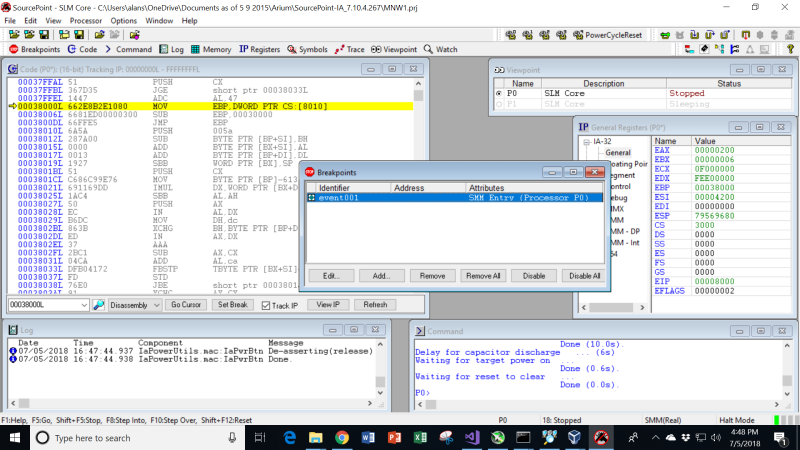
I know that SMI’s happen naturally as part of the BIOS boot process, so it was a simple matter of firing up SourcePoint, setting a breakpoint on SMM Entry, and then using the “Power Cycle Reset” macro to catch the first SMI:
As can be seen in the image, the start address is indeed x’38000’. Down in the task bar in the bottom right, you can also see that we are in “SMM(Real). The processor is halted – the breakpoint is hit – and you can see the GPRs in the Register window to the right.
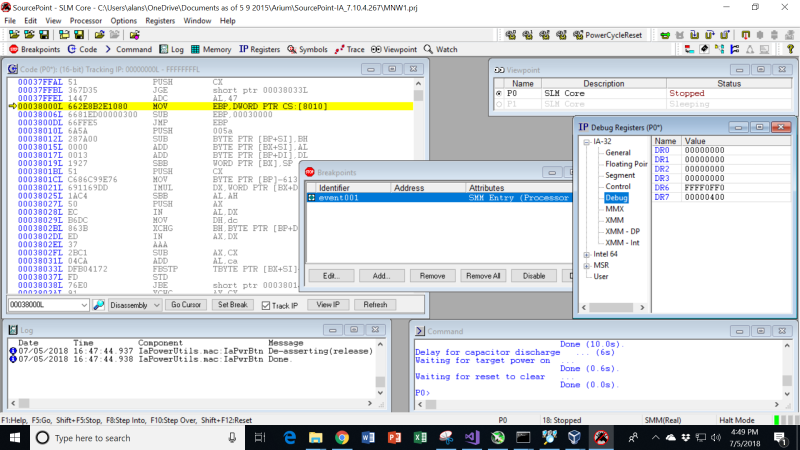
One thing I did notice is that in the Breakpoint window, the Breakpoint List window to the left shows the breakpoint as being active, and is populated by a green diamond. This indicates it is a “Processor” breakpoint. If it were a “Hardware” breakpoint, the checkbox would be red. I decided to look at the debug register contents, and in fact there is no indication of a hardware breakpoint being used (DR0 through DR3 are all zeroes). So, this is a special kind of breakpoint:
Note the first three instructions of the SMI handler:
MOV EBP, DWORD PTR CS:[8010]
SUB EBP, 00030000
JMP EBP
The first instruction loads the EBP register with whatever is stored at CS:[8010], the CS:IP pair (note that we are in real mode). Here, CS is x’3000’. Then, x’30000’ is subtracted from the contents of EBP, put back into EBP, and then a jump is made to that address.
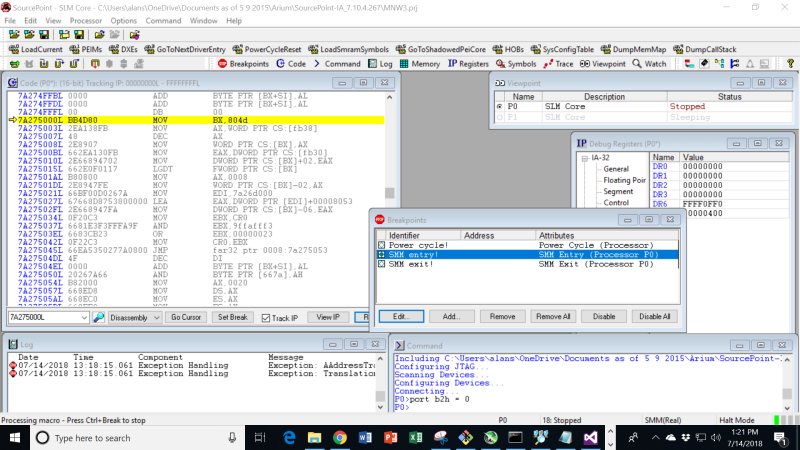
This takes us out into the “weeds”:
Also, I found that different runs (after power cycles?) could take me to different start addresses, all of which started with the MOV BX, 804d instruction. Perhaps different kinds of SMI (for different purposes) are indexes somehow into different hardware handlers. Without source code, it is kind of hard to tell.
I did play around and generate SMIs using a couple of different techniques. For example, a write of ‘0’ into IO port x’B2’ will generate an SMI after the next “Go”. This can be used via the SourcePoint command language, by just typing:
port b2h = 0
into the Command window. This works like a charm.
Another way of doing this is to use the memory modify “mm” command from the UEFI shell. Type in:
mm b2 0 -io
while the target is running. Halt the target, set the breakpoint, and hit Go. Then hit the Enter key on the MinnowBoard target keyboard (it is likely that SMM is being used to make the keyboard work in real mode). The keyboard on the MinnowBoard freezes up, but the breakpoint is hit. Removing the breakpoint, and hitting Go again, releases the keyboard.
I did get to wondering, is it possible to look at the source code? Does the MinnowBoard UEFI debug build contain the source code for the SMI handlers? There’s only one way to find out…in the next episode!
If you’d like to learn more about the use of SourcePoint in exploring low-level x86 architecture, have a look at our eBook, Guide to Intel Debug & Trace, by industry luminary Larry Traylor (note: requires registration).


