I discover an incredible Trace capability that’s built into the Intel Atom Bay Trail chip!
My Minnowboard Turbot has a dual core 64-bit Intel® Atom™ “Bay Trail-I” E3826 System on a Chip (SoC) on-board. Like most Intel CPUs, it supports the standard Last Branch Record (LBR) and Branch Trace Store (BTS) trace capabilities.
LBR stores a very limited amount of trace information (typically 4 – 16 branch locations) inside model-specific registers (MSRs). It has virtually no overhead.
BTS uses cache-as-RAM (CAR) or system DRAM to store many more instructions and events, limited only by the amount of memory on the target system. Unlike LBR, BTS overhead impact is anywhere from 20% to 100%.
So, LBR and BTS provide limited trace capabilities, limited by trace depth and performance overhead, respectively. These constraints are one of the things that can make debugging Intel platforms very challenging. Many different approaches to debug have emerged to work around these constraints.
In my early days of tinkering with the Minnowboard, I used LBR to demonstrate Trace on ASSET's JTAG-based debugger, SourcePoint. In Episode 6, there’s a good screenshot of the instruction trace within a call to DebugPrint(). But the trace depth was very shallow; I wanted to go back much further in time.
As it turns out, the Bay Trail platform supports a much more powerful trace capability, known as Instruction Trace. One of the most important features of Instruction Trace in Intel’s newer ICs is that it is nearly full speed: it has no significant impact on the execution speed of the program being executed. In contrast, when using Branch Trace Messages (BTMs) with BTS (storage to memory), there is a minimum of a 60% slow down. For some code this could be much greater. Instruction Trace uses highly compressed packets and has no measurable impact on code execution. This change in execution speed can often impact whether a bug does or does not occur.
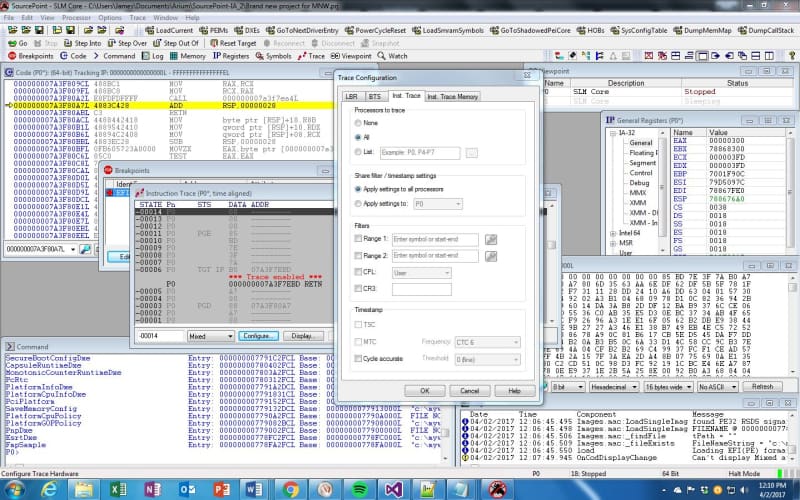
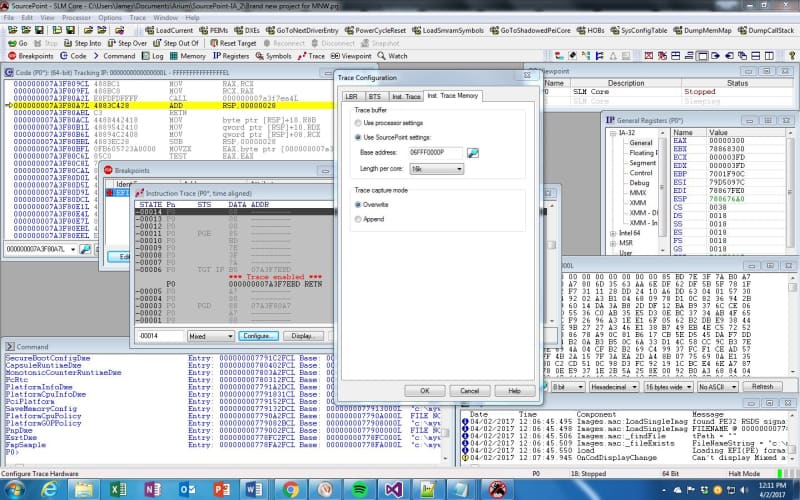
Instruction Trace is easily configured within SourcePoint by going into the Trace Configuration dialog boxes for this capability. It’s a few mouse clicks to enable the feature and designate the memory location and buffer size for the trace data to be stored:
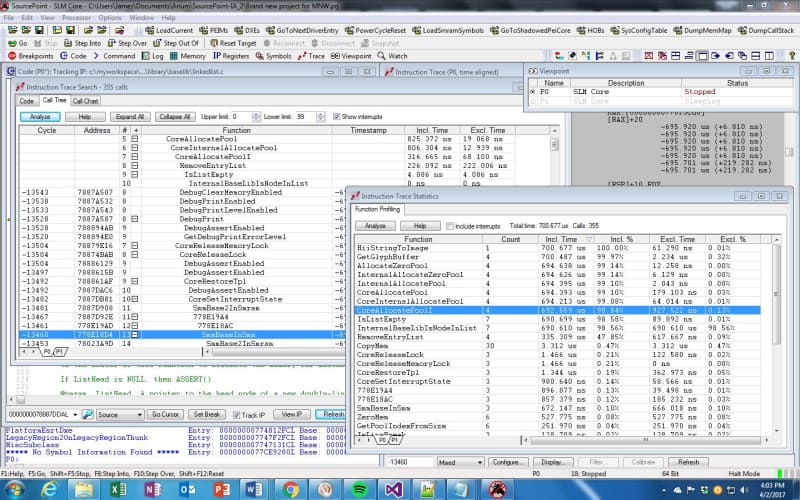
Once that was all configured, I reset the target and collected trace data while the target was running a UEFI shell script to output the configuration space of a PCI device. With SourcePoint, it’s possible to see the code instruction trace in several views, all of which provide great power to the designer. Here is a view of the Call Tree and the timing statistics associated with the invocation of the stacked functions:
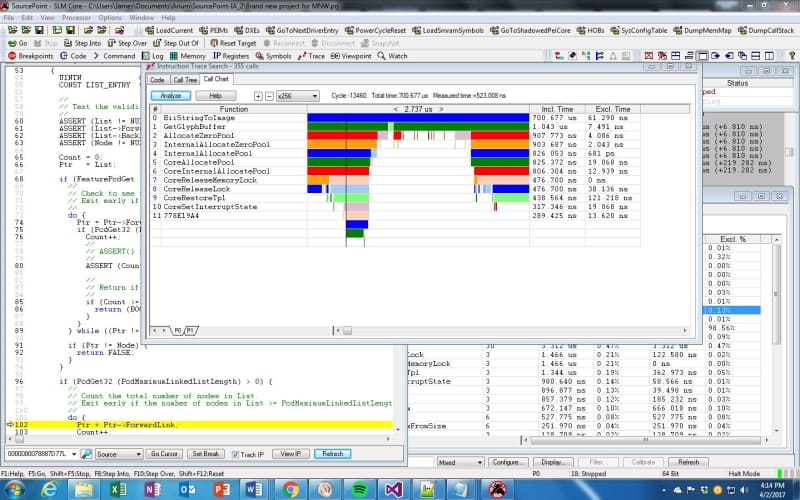
It’s possible to use these very effectively to do a code walk-through and see where the firmware is spending its time. But, even more powerfully, the Call Chart tab in the Instruction Trace Search window provides a visual display of code execution:
The Call Graph display allows the SourcePoint user to look at large portions (or even all of) the trace buffer, and view it in a graph showing call depth. Each line in this graph represents a different function at a different point in time. Changes in color represent changes in a function. Each line moving downwards represents another level of call depth. A moveable cursor points to specific points on the timeline (the x-axis of graph). The left-hand column displays the names of the functions, at each level, at the point indicated by the cursor. And the controls above the graph allow the user to expand the graph (zoom in) at the point indicated by the cursor.
This was pretty amazing to see. I was under the impression that the older Bay Trail devices were limited to LBR and BTS trace capabilities. But with Instruction Trace, much greater debugging functionality is available. Tinkering around with this has really helped me understand the overall flow of execution of the UEFI code base.
Incidentally, an excellent treatise on Instruction Trace is available in the eBook Intel Adds High-Speed Instruction Trace (note: requires registration).
Last week’s Minnowboard Chronicle was Episode 10 and covered my explorations within the UEFI Shell.


