This week, I single-step through source code to track the execution of programs, and better understand how the Minnowboard BIOS works.
I’m really curious as to the overall UEFI structure program flow as a platform boots up. A lot is happening as the platform initializes, and the source code is very large, so it’s hard to see what the code is doing from just a static viewpoint. I wanted to see what routines call and are called by other routines. Seeing the code execution flow from close-up is definitely a learning experience.
The best way to do this is to step through the code at my own speed, as opposed to the speed that the code normally executes at. SourcePoint provides stepping operations that, in conjunction with the go/stop and breakpoint capabilities, allow me to effectively track through the execution of programs.
It is worth noting that there are three stepping commands available:
Step Into. This single-steps the next instruction in the program and enters each function call that is encountered. This is useful for detailed analysis of all execution paths in a program.
Step Over. This single-steps the next instruction in the program and runs through each function call that is encountered without showing the steps in the function. This is useful for analysis of the current routine while skipping the details of called routines.
Step Out Of. This single-steps the next instruction in the program, and runs through the end of an existing function context. This is useful for a quick way to get back to the parent routine.
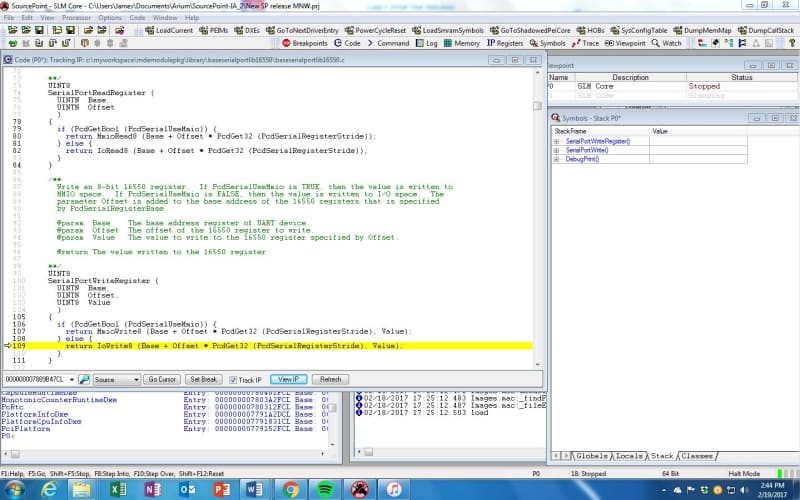
To put these through their paces, I broke within the SerialPortWriteRegister() routine. The source code and instruction pointer is visible on the left. From the Call Stack on the right, you can see that SerialPortWriteRegister() is called by SerialPortWrite() which in turn is called from DebugPrint():
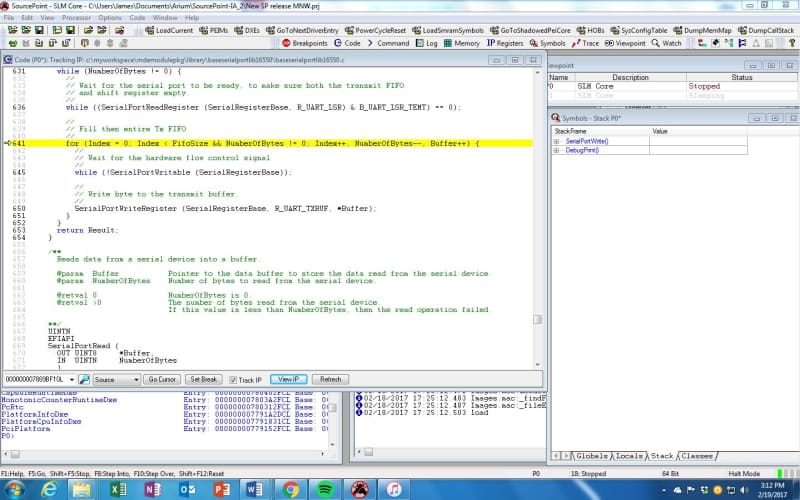
I decided to Step Into some number of execution steps, and as expected the SerialPortWriteRegister() function returns, and I can come into SerialPortWrite() – as can be seen by the StackFrame display updating in real-time:
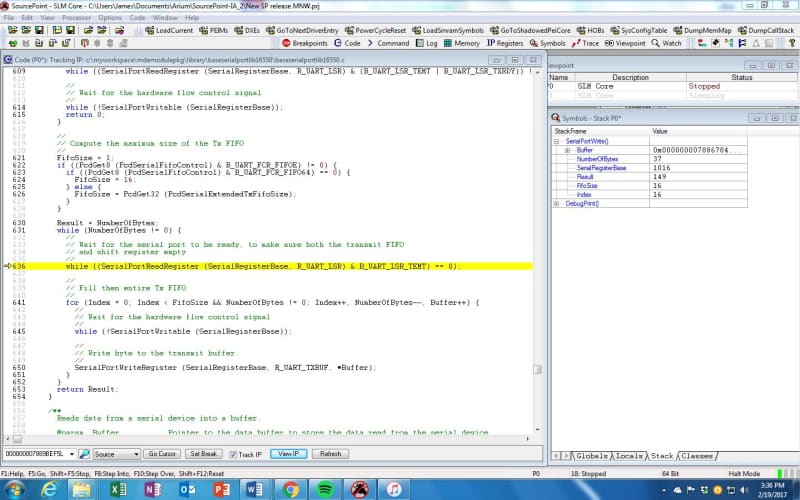
It can be seen that within SerialPortWrite() I’m in the middle of a “for” loop that makes multiple calls to SerialPortWriteRegister() indexed by the values of Index and NumberOfBytes. It’s easy enough to hover over the values of these variables in SourcePoint and also look at the Locals tab in the Symbols window to see how deep the "for" loop is:
Oh, this is going to take a while. Index is 8, and FifoSize is 16, but I also have to get NumberOfBytes down to 0. So, I dutifully start to click Step Over, expecting this to take a while. But wait! Maybe Step Out Of is a solution to my problem.
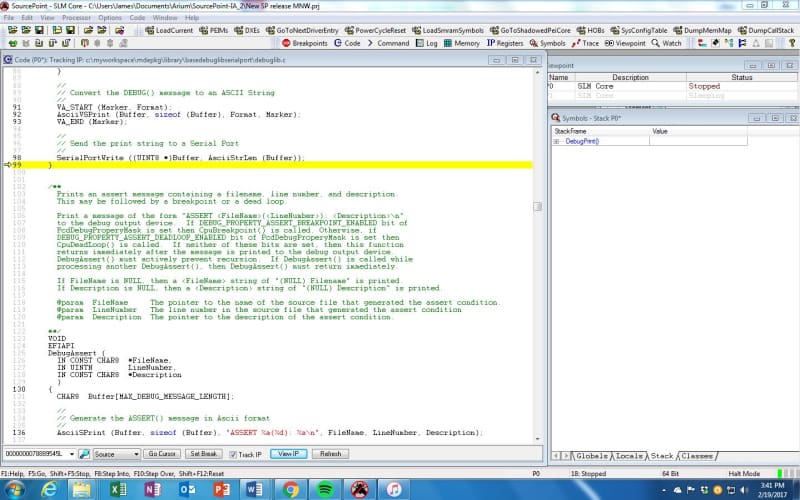
And that does turn out to be the case. I get right back into DebugPrint():
Step Into one more time puts me into a whole new section of code. I’m in PeCoffLoaderExtraActionCommon() and within the pecoffextraactionlib.c (whereas before I was in debuglib.c). What is this? More exploration forthcoming!
For those who would like to learn more, there’s an excellent eBook here: UEFI Framework Debugging (note: requires registration).


