This week, I delve into using LBR (Last Branch Record) Trace on the Minnowboard, and continue my exploration into the UEFI source code.
Last week, in the Minnowboard Chronicles – Episode 5, we saw how our SourcePoint debugger could be used to view the UEFI Hand-off Blocks (HOBs), System Configuration Table, System Memory Map, and other structures. Single-stepping through source code and watching the Call Stack dynamically update in real-time was also fascinating. This is one of the best ways to gain hands-on experience with UEFI, in my humble opinion.
This week, I decided to employ one of the most powerful capabilities within the Intel architecture, the on-die Trace logic. Specifically, of interest are the Last Branch Record (LBR) and Branch Trace Store (BTS) functions.
LBR trace displays a history of executed instructions. It does this by reading Branch Trace Messages (BTMs) from the Last Branch Record MSRs in the processors. The advantage of LBR trace is it is non-intrusive. The processor can run at full speed when using LBR trace. The disadvantage of LBR trace is the limited number of LBRs available (typically 4 – 16). Each LBR stores a single BTM. If you assume an average of 5 instructions between branches, then roughly the last 80 instructions executed are traced.
BTS trace displays a history of executed instructions. It does this by reading Branch Trace Messages (BTMs) from the Branch Trace Store (BTS), an area of system memory set aside for trace. The BTS can be much larger, and store many more BTMs than LBRs. The disadvantage of using the BTS is that writing BTMs to memory takes longer than writing BTMs to LBRs. Each branch results in 12-24 bytes of memory being written. For some applications BTS trace may result in too high a speed penalty to use. Another disadvantage of BTS trace is the inability to trace out of reset (if memory is unavailable). Still, getting the much larger buffer can be a good trade-off.
It is worthwhile noting that LBR trace and BTS trace are not mutually exclusive. They can both be enabled at the same time.
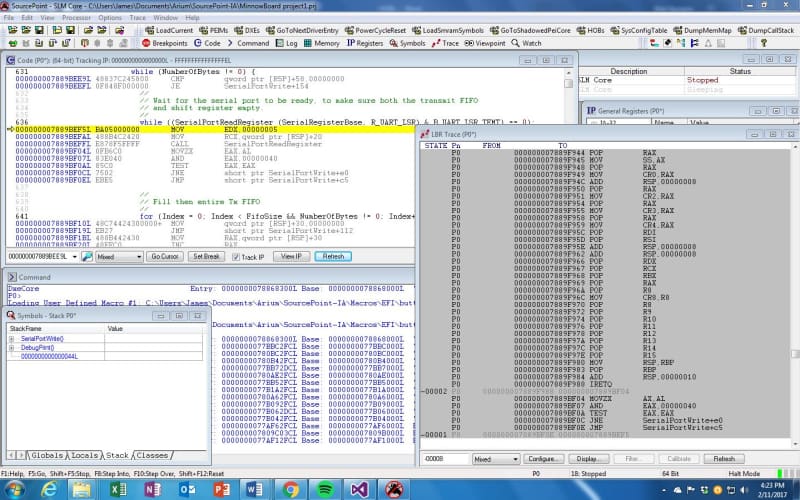
To see LBR Trace in action, I used the SourcePoint LBR Trace Configuration tab to start tracing, powered up the Minnowboard, and halted it in the middle of an I/O intensive operation: specifically, in the middle of a DebugPrint(). The displayed screen shows the Trace window in a meaningful code context with the instruction pointer highlighted in the Code window:
Let’s look carefully at the screen shot to see exactly what is happening.
You see in the top left in the Code Window that we are viewing the code in “Mixed” mode: that is, the ‘C’ source code is interleaved with its associated assembly language instructions. The instruction pointer points to the beginning of the processor instructions associated with the line of code:
while ((SerialPortReadRegister (SerialRegisterBase, R_UART_LSB) & B_UART_LSR_TEMT) == 0)
The instruction pointer is at address ‘000000007889BEF5’L. Note that the ‘L’ signifies a memory linear address, and we are in real (or protected) mode. This is the same as the physical address if paging is not in effect. We are within the SerialPortWrite() function.
In the LBR Trace window, we see the instructions that were executed prior to the location of the instruction pointer. The State field displays the state number (cycle number) of the instruction. The trigger location is marked as 0. Cycles before the trigger are shown as negative numbers. In the first cycle, you can see that we are inside the “while” loop; the five assembly language instructions shown correspond to the last five assembly language instructions shown in the Code window. This is the bottom of the “while” loop, where the JNE SerialPortWrite+e0 and the JMP SerialPortWrite+c5 instructions handle the conditional logic of the loop.
But then the information in the Trace window gets interesting. Where State shows -000002, we see a bunch of assembly language instructions ending in an IRETQ instruction. IRETQ is a 64-bit return from an Interrupt. So, just before the MOVZX AX, AL instruction, we have just gotten back from an interrupt service routine, wherein there were a bunch of POP statements that restore the values of the general purpose registers (GPRs) from the stack.
At least that’s my interpretation as of this moment. I’ll need to dig into this a little more to confirm my theory. A good place to start might be to look at the SerialPortReadRegister function in some more detail.
I’ll continue this exploration of the Minnowboard using SourcePoint next week.


