Run-control technology is rapidly becoming a de facto standard for forensics retrieval within high-availability, Intel Xeon-class servers. How did this standard come to be established?
Successful deployment of mission-critical, high-availability systems is highly dependent upon accurate fault isolation of hardware, firmware and software faults. It is through detection and diagnosis of these faults that root cause is determined, and corrective action is taken – be it in the form of silicon changes, hardware updates, software patches, and the like.
Much of this isolation can be accomplished via OS-based diagnostics. But what happens if the main board CPU is not responsive and the OS routines cannot be run? Then out-of-band (OOB) mechanisms must be used, often based upon separate logic within the CPU which may be unaffected by the outage. And a means to communicate with this discrete logic must be present, to activate it and have it perform the necessary forensics retrieval.
Run-control is such a mechanism. Run-control refers to a (typically) JTAG-based OOB mechanism which activates specific debug logic within a processor. JTAG, plus possibly some sideband signals, is used to scan in and out specific information via TDI and TDO, and the state machine is controlled by TCK, TMS and (optionally) TRST. Run-control in some form is available on most modern CPUs above a certain complexity.
On Intel platforms, run-control is referred to as In-Target Probe (ITP). It forms the basis of modern hardware-assisted debuggers, such as ASSET’s SourcePoint tool. SourcePoint is a powerful source-level debugger, with support for Intel Processor Trace, Trace Hub, and Intel CScripts execution, among other capabilities.
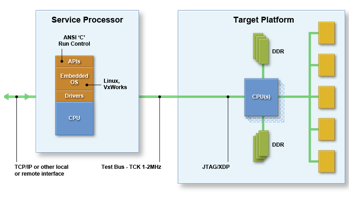
A subset of SourcePoint’s functionality can be provided in-situ on a platform by embedding Intel ITP firmware within a target’s BMC. The underlying ITP primitives, such as EnterDebugMode, ReadMSR, WriteIO, etc. are made available within the BMC’s firmware stack, typically (but not limited to) being based upon Linux. The on-target topology looks like this:
This solution, first delivered by ASSET, became available on Cray’s supercomputers back in 2009. You can read the initial press release here: Cray announces partnership for embedded diagnostics in supercomputers. Further public information on this usage model is available in the Cray User Group paper, Cray XC System Level Diagnosability: Commands, Utilities and Diagnostic Tools for the Next Generation of HPC Systems. To quote from the Abstract:
The Cray XC system is significantly different from the previous generation Cray XE system. The Cray XC system is built using new technologies including transverse cooling, Intel processor based nodes, PCIe interface from the node to the network ASIC, Aries Network ASIC and Dragonfly topology. The diagnosability of a Cray XC system has also been improved by a new set of commands, utilities and diagnostics. This paper describes how these tools are used to aid in system level diagnosability of the Cray XC system.
For more information on ASSET’s implementation of embedded ITP, which we call ScanWorks Embedded Diagnostics (SED), please see our website at http://www.asset-intertech.com/products/embedded-diagnostics, and our technical overview (note: the latter requires registration).


