Programmers debugging BIOS (known as UEFI today) have debugged complex systems without using any Trace features for 20 years. This is all about to change.
Today’s UEFI code base has grown to 7MB or even more. This is a very large boot loader for an Intel-based system. And code complexity (and difficulty of debug) grows exponentially with code size.
Add to this, the challenges of multicore versus single-threaded code, as well as totally asynchronous events from different logic elements (such as the Intel Management Engine (ME) running independently of the host cores, and a BIOS engineer’s job is more difficult than ever before.
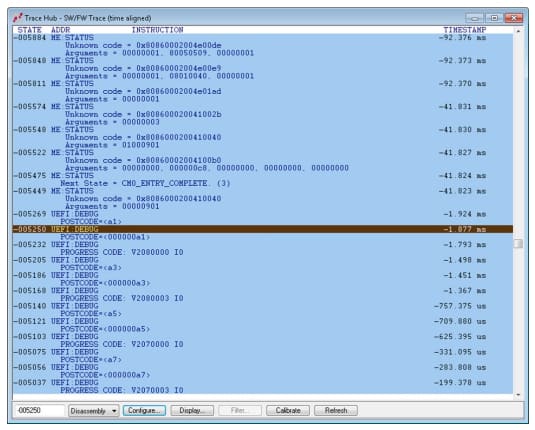
But, Intel has added new trace capabilities (Intel Processor Trace and Trace Hub) to its silicon, circa 2015, which allows an engineer to observe program state, program execution trace flow, and their correlation with messages sent from these other logic elements and the BIOS itself. An example screen shot from Intel Trace Hub output of interleaved UEFI and ME messages is below: 
This is a complex and fascinating subject, and more detailed treatment of these topics is in our eBook, New Methods for Software Debug find Root Cause Faster.


