In my last blog, I reviewed the difference between Run-Control and Trace, as two powerful debugging technologies. How are they used together to dramatically improve the chances of catching an intermittent bug?
In the Run-Control versus Trace for debugging blog, it was shown that run-control allows the engineer to look forward in time, by stopping the processor execution at a point near where a bug is thought to exist, and then single-stepping forward. Intel Processor Trace (PT) allows the engineer to look backward in time, in terms of what code was executing (even on a different thread, core or socket) synchronously in time. The new Intel Trace Hub (see our press release announcement, ASSET InterTech’s SourcePoint is first debugger to take full advantage of Intel Trace Hub) also allows a peek backward in time, at debug messages originating from other system logic, such as the Management Engine (ME), or instrumented UEFI.
In the most powerful debug scenario, the external debugging application (for example, ASSET’s SourcePoint debugger) has intimate knowledge of what code is executing on the target at the time the system is halted, and how it maps to what has been captured in the Intel Processor Trace and Trace Hub buffers. This is done with timestamps and sophisticated software. Let’s look at an example.
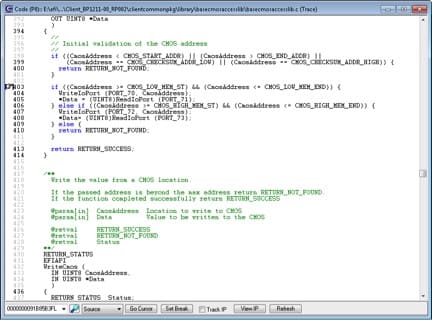
Here’s a Code window with the arrow pointing to the Instruction Pointer:
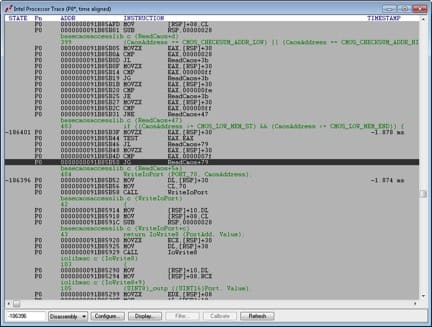
We can correlate this with the time-stamped contents of the PT buffer, going back many seconds of instructions in time, depending solely upon the buffer size:
Similarly, we can use Trace Hub to look at what UEFI and the ME were doing, at exactly these times (sorry, I can’t display this screen shot within this blog, due to NDA restrictions).
In any event, you should get the picture by now. It sure beats debugging using the old methods of using LEDs, hex displays showing POST codes or console debug print output.
For more information on the use of Trace for debugging Intel platforms, check out our eBooks, UEFI Framework Debugging, and Hardware-Assisted Debug and Trace within the Silicon.


