Last week we reviewed how voltage margining was performed on DDR3 and DDR4-based systems. How is timing margining done?
In DDR4 vs DDR3 Memory Voltage Margining, it was shown that for DDR3 memory, VREFDQ is supplied externally, and is thus altered under control of external potentiometer circuitry, which is accessed via I2C from the memory controller. With DDR4, on the other hand, VREFDQ is generated on the memory die, which means that the DDR4 memory internal VREFDQ must be varied under control of the memory controller. The DRAM controller manages the on-die VREFDQ through a programmable configuration register (in this case, mode register 6 (MR6), bits 7:0) which resides in the DRAM.
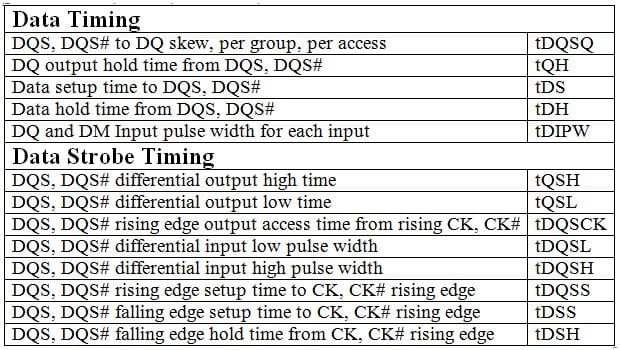
For margining of DRAM timing, there is no external circuitry involved, but similarly is circumscribed by the memory controller. Control of memory timing is critical, and there is a plethora of key timing requirements and parameters as described in the JEDEC specifications, as is excerpted here:
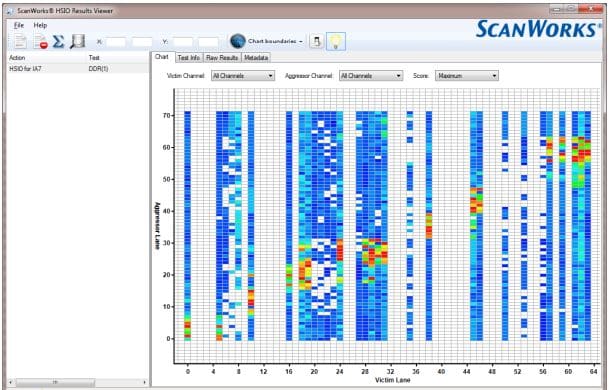
Compliance of the system to the JEDEC standards for timing is the purview of high-end memory compliance analyzers. But, a key requirement is to measure the performance of the system as a function of varying the data strobe timing versus the data timing. For example, RxDQ and TxDQ tests change the DQ to DQS timing offset for read and write cycles. All sorts of margining tests can be run from this simple foundation. For example, from a simple 1D test of timing margins vs lanes, to a more sophisticated test which determines which aggressor lanes, or groups of lanes, have the most impact on a given target signal, or “victim” lane. This lets the engineer easily generate lane-to-lane crosstalk metrics and signal group (channel or byte group) to lane crosstalk metrics. For example it can evaluate the effect of lane 22 on lane 32 within channel 0 or the effect all of the channel 1 signals as a group on lane 32 in channel 0. A simple example would look like this:
In the graph, blue designates a low score, red a high score, and green/yellow/orange in the middle of the defined score values.


