In my last article, I outlined a short embedded JTAG-based ‘C’ routine to dump machine check errors in the event of a system crash or hang. In today’s blog, I look at this in the larger context of diagnosing the root cause of system wedges, and what embedded ITP techniques can be used to gather as much forensics data as possible.
In A Short Routine to Dump Machine Check Errors Using Embedded ITP, we showed how simple it is to create a small On-Target Diagnostic (OTD) using ASSET’s ScanWorks Embedded Diagnostics (SED) product. This OTD dumped the machine check error data associated with a specified socket, core and bank. It’s easy enough to modify this source code to dump all banks on all cores on all sockets, select and examine the individual registers therein, and perform other tasks.
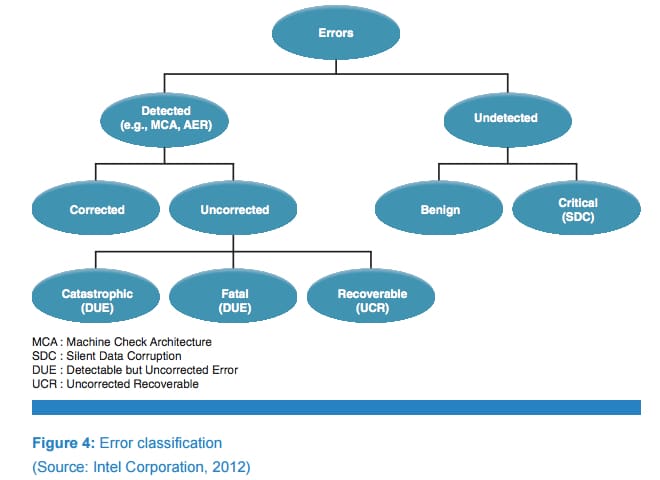
But, what do we do with this information, and what other useful data might we retrieve to help root-cause the source of machine check exceptions and system wedges? Firstly, a general topology of error classifications can be seen in the article Autonomic Foundation for Fault Diagnosis in the Intel Technology Journal, Volume 16, Issue 2, 2012. See below:
Detectable but Uncorrected Errors (DUE) can manifest themselves via blue screens or other system hangs/crashes. In Intel designs, internal processor errors, such as a processor instruction retirement watchdog timeout (or three-strike timeout) “wedge” the system, will cause a CATERR assertion and can only be recovered from by a system reset. Identifying the root cause of such events is notoriously difficult, as the system is effectively wedged and cannot be put into full probe mode by JTAG-assisted hardware debuggers. In such extreme cases the machine check error handler at vector 0x18h does not execute correctly. But, some breadcrumbs can still be retrieved, especially by SED-based OTDs.
As an aside, a good Intel reference on processor instruction retirement watchdog timeouts can be found here: Processor Reorder Buffer (ROB) Timeout Debug Guide. Keep in mind that ROB timeouts are only one of many types of internal, catastrophic errors. This document is a little dated, but does give a good high-level overview.
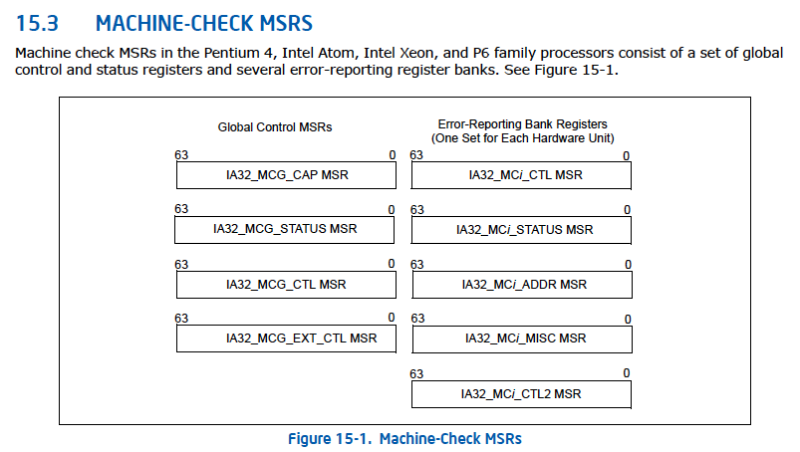
To understand the more technical detail, excellent public references on this are the Machine Check Architecture and Interpreting Machine Check Error Codes chapters within the Intel® 64 and IA-32 Architectures Software Developer’s Manual, Volume 3B; and the Skylake Server External Design Specification (EDS), Volume One: Architecture. I’ll excerpt the techniques relevant to triaging a three-strike timeout on an Intel Xeon Processor Scalable Family part. As a reference, since the machine check MSRs play such a critical role in root cause resolution, here’s an image excerpt from the SDM:
In an SED environment, the BMC must await assertion of the #MC signal (CATERR or MSMI), and then act accordingly. The first step is usually to query the uncore registers, also known as CSRs (Configuration and Status Registers) via PCI configuration space. This is because the uncore comprises the shared LLC cache, CHA, IMC, PCU, Ubox, IIO, and UPI modules. The PCU, per the Broadwell EDS, captures the error sources in the MCA_ERR_SRC_LOG, which is located at Bus(1), Device 30, Function 2. This usually indicts the offending socket, and characterizes the fault as an MCERR or IERR. The SED API that reads the uncore registers (in fact any CSR) has the following form:
int ai_ReadCSR(int mHandle, unit16_t DeviceNo, unit16_t FunctionNo, unit16_t Offset, unit32_t *RegisterData);
After this, it’s a matter of reading the applicable MC MSRs from all the processor cores within the socket that asserted the IERR. Chapter 16 of the SDM is an excellent reference to the methodology to be used. For example, Section 16.9 outlines that incremental error codes for internal machine check errors from the PCU controller are reported in the register bank IA32_MC4. And in Table 16-28, it is noted that on an IERR caused by a core 3-strike, the IA32_MC3_STATUS (MLC) is copied to the IA32_MC4_STATUS (after a 3-strike, the core MCA banks will be unavailable).
Are there more forensics nuggets to retrieve? Of course. The Intel CScripts provide a lot of functionality in this respect. For an OTD, it is worthwhile retrieving the extended machine check state MSRs (starting at address 180H to retrieve the value of the General Purpose Registers (GPRs)). And the Last Branch Record (LBR) trace mechanism can be extremely useful in CATERR/IERR debugging sessions. Although one core threw a three-strike and is responsible for the CATERR, the information in the LBR stack for other cores provides the ability to reconstruct a better picture of what was going on right before. For more on LBR and how I used it to reverse-engineer code execution, see the articles Using LBR Trace without Source Code, and Reverse-Engineering Code Execution.


