ASSET gets a nod at the Open Compute Summit for our leadership in At-Scale Debug.
A few weeks back, I attended the Open Compute Summit in San Jose, CA. The show was a resounding success, with over 3,000 attendees, up 17% over last year. With over 100 engineering workshops and 80 exhibitors, I was hard-pressed to see and do everything I had planned to over the two days. But, with all the presentations available as PDF and recorded video at http://www.opencompute.org/events/past-summits/, I can always go back and recap on the material I missed – the only gating factor being time available!
The 100+ engineering workshops were divided into nineteen tracks:
Advanced Cooling
Compliance & Interoperability
Data Center Facility
HPC
Hardware Management
New Servers & GPUs
Networking Case Studies & Roundtable
Networking Demo & Telemetry
Networking Lessons & SONiC
Networking Optics
NW: SAI Programmabilit
OPEN. FOR BUSINESS. – Adoption Stats and Stories
OpenBMC
Power
Rack & Power
Security & System Firmware
Server
Storage
Telco
The OpenBMC track is of special interest to me, as ASSET delivers its ScanWorks Embedded Diagnostics solution using this framework. For those who might be unfamiliar, OpenBMC is a Yocto-based open-source framework to deliver a complete BMC board, development and build environment. Designed for the ASPEED AST family BMCs, OpenBMC is a real success story: it has become the de facto environment for hardware management in just about the entire hyperscale market, as well as a number of OEM platforms.
The OpenBMC workshop had the following presentations:
- OpenBMC Hardware Platform Development Guideline, Robert Feng
- Google’s Work on OpenBMC, Nancy Yuen
- OpenBMC on Project Olympus, Ali Larijani
- Facebook OpenBMC Updates, Sai Dasari; Christopher Covington
- OpenBMC End User Features and Function, Andrew Geissler
- State of OpenBMC Development, Brad Bishop
- Intel’s Journey with OpenBMC, James Mihm
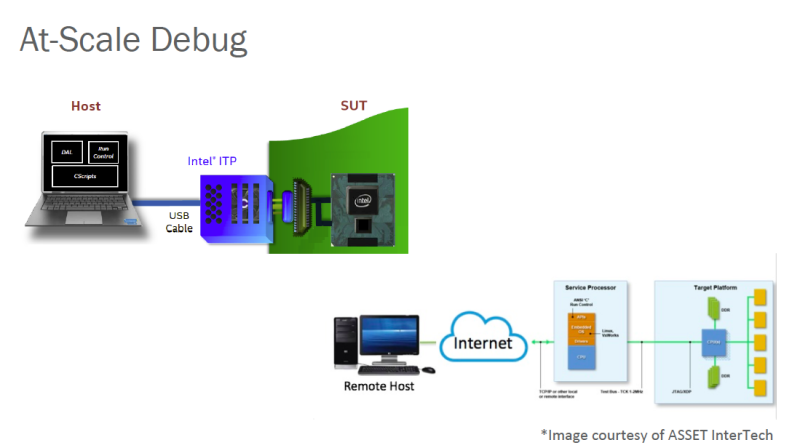
Several of these presentations mentioned the principle of remote debugging via JTAG, since it has been established as a standard part of the Microsoft Azure Project Olympus open server specification. The most interesting one to me was the Facebook OpenBMC Updates slide deck, by Sai Dasari and Christopher Covington. In it, ASSET’s graphic depicting the At-Scale Debug topology got a reference:
The graphic at the top left is a standard benchtop JTAG hardware-assisted topology, whereby a remote host running the Intel CScripts uses a hardware pod (in this diagram, the Intel ITP blue box; or alternatively the ASSET ECM-XDP3e) to connect to the XDP interface on a system-under-test (SUT).
The graphic at the bottom right with the “Image courtesy of ASSET InterTech” caption depicts a typical At-Scale Debug topology. The hardware pod disappears, and the remote host again runs the Intel CScripts, but this time can connect remotely and directly to the BMC target over Ethernet. This is ideal for “lights-out” situations where physical access to the target may be impossible.
It is worthwhile to note that this latter topology is supported by ASSET’s ScanWorks Embedded Diagnostics product, but it is not the only (or, perhaps, even the most useful) application of At-Scale Debug. A remote host running the CScripts is powerful, but it also has several limitations:
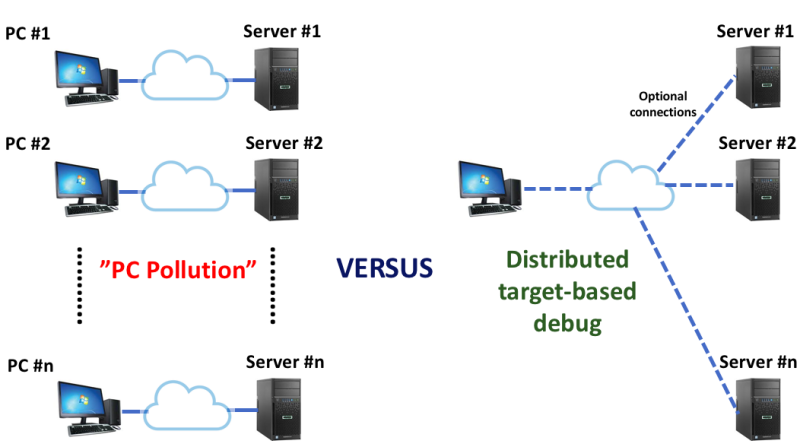
- A remote PC is needed for each concurrent debugging session
- Overall system performance can be much slower than the benchtop version
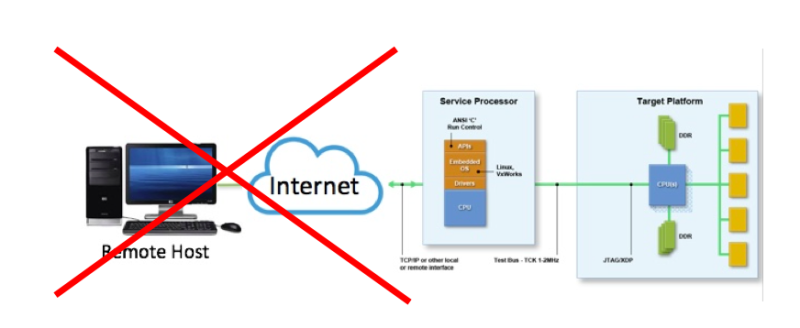
- The Ethernet connection and remote host present a potentially large attack surface
ASSET’s ScanWorks Embedded Diagnostics gets around these limitations by offering the option of running the debug applications directly down on the BMC. We accomplish this by having the Intel ITP run-control library down on the BMC, as opposed to back at the remote host. Thus, the remote host is no longer in the picture:
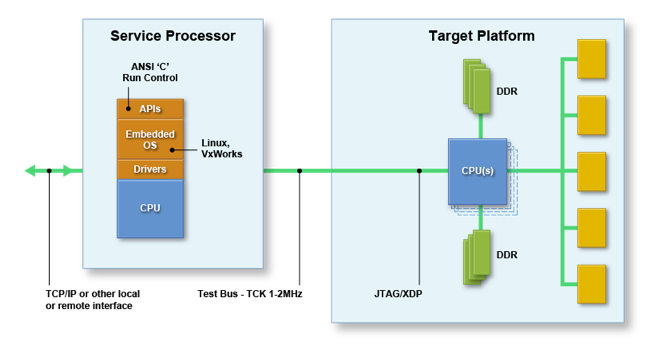
And the BMC itself hosts the debug agent Intel ITP run-control APIs:
Thus, the normal JTAG-assisted debug functions, such as ReadMSR, WriteIO, etc. are available for programmatic access within the OpenBMC framework. This allows the target-based debug agent to run as part of normal system operation, such as part of Power-On Self Test (POST) or Built-In Self Test (BIST), as opposed to on an exception basis via the remote host-based debug agent. A target-based interrupt back to a Rack Manager to initiate a CScripts-based debug session is no longer required; JTAG can be fired up autonomously by the target, forensics results can be dumped or tests can be run, and the platform can then be quickly restored to service. So, we eliminate the “PC Pollution” model whereby there needs to be a remote connection for each simultaneous debug session:
A distributed target-based debug model provides far more capability for in-situ debug and test functions. Of course, where a full Python CScripts-based debug session is needed, or interactive debug is warranted, a remote host model is supported as well.
A good use case of an out-of-band POST feature to validate PCI Express channels is described in Embedded Run-Control for Power-On Self Test. And the use cases are not restricted to merely debug functionality; with the JTAG Master on-board, boundary scan-based BIST can be applied to detect latent structural defects in high-availability systems, as documented in Embedded JTAG for Built-In Self Test. These capabilities can be applied anywhere from fighter jets to satellites to self-driving cars to servers and beyond; wherever system reliability, availability, and serviceability are crucial.
For more information, please feel free to download our ScanWorks Embedded Diagnostics Technical Brief.


