In previous articles, I’ve written about the use of JTAG-based run-control for remote debug. Facebook presented an example of this a few weeks ago at the Open Compute Summit. This blog describes the real-time performance of such a BIST we designed for PCI Express link training tests.
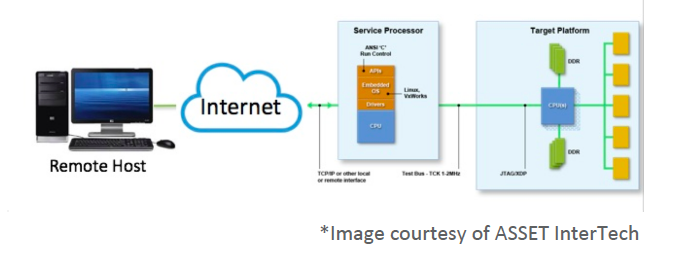
In last week’s article, Facebook OpenBMC At-Scale Debug at the OCP Summit, I wrote about the fundamental difference between At-Scale Debug applications that require a remote host to run on a target, versus others that can be resident on the target itself. As per the Facebook slide presented at the OCP Summit, a host-based version was shown diagrammatically as below:
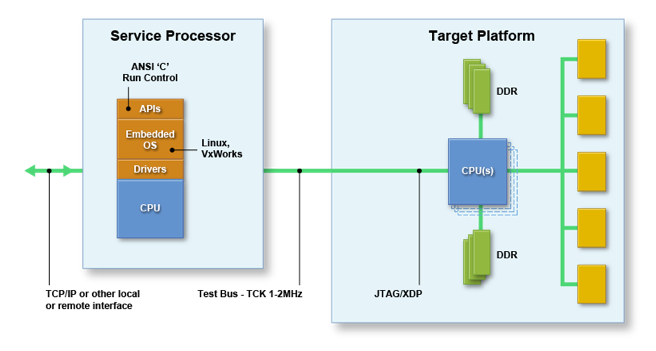
Whereas, the target-based version of At-Scale Debug eliminates the remote host and the possibly insecure connection to it, and runs natively down on the target:
 The TCP/IP or other local or remote interface, in this instance, is entirely optional. Thus, any sort of test, debug, or hardware validation routine can run independently down on the target, and the results stored on the target for later retrieval. We call such diagnostics On-Target Diagnostics, or OTD for short. OTD can be invoked autonomously by the target itself, in response to a prescribed event such as a midnight audit, system power-on, or system health check; or unprescribed event, such as a system failure, or exceeding of a threshold for some system operational measurement. Because it is built into the system, this capability is often termed as Built-In Self Test (BIST), or for short, Built-In Test (BIT). And, by definition, any BIST can be invoked “manually” through human or machine intervention via a remote host, if a local or remote host interface is in place.
The different types of BIST employed vary widely based on the reliability, availability and serviceability (RAS) goals for the system under test. For a cell phone, BIST may be very simple; some basic tests are run when the cell phone is powered on or rebooted; and if there is a failure, the screen goes dark, and you return it to the store. For a mission-critical system such as for example the F-35 Lightning II fighter plane, component BIST must be completely comprehensive and reliable, with extremely high levels of test coverage and diagnostic granularity. Otherwise, as described in a quote from a Forbes article, we may find ourselves in this situation:
The availability of the fighter jet for missions when needed — a key metric — remains “around 50 percent, a condition that has existed with no significant improvement since October 2014, despite the increasing number of aircraft,” Robert Behler, the Defense Department’s new director of operational testing, said in an annual report delivered Tuesday to senior Pentagon leaders and congressional committees.
So, BIST is very important.
One such example of a BIST that we have designed for Intel-based platforms as an On-Target Diagnostic (OTD) is for PCI Express stress testing. The specifics of the test is described in the article at Embedded Run-Control for Power-On Self Test. The routine, called lt_loop(), exercises the link training and status state machine (LTSSM), and looks for root cause of any of the following symptoms:
- Lowered throughput/performance
- Errors are logged
- Drivers do not load properly
- Speed degrades
- Link width degrades
- Intermittent dropouts
- Surprise Link Down (“SLD”)
- Device Not Found (“DNF”)
- System crash/hang (“blue screen”)
One option for the lt_loop() function is to repeatedly retrain a link, and change the speed from Gen1 (2.5GT/s) to Gen3 (8.0GT/s) repeatedly. The parameters are:
-l<number> number of loops to test
-p<number> port number to test
-t<number> loop type (the type of test)
-d check for downstream component errors (default = don’t check)
A console output for running this routine is as follows:
root@bmc:~# ./ltloop -p10 -l1000 -d -t6
Link Training Loop test
Library version = 0.21.11 (base = SKL0.0.5)
Selecting socket 1
Entering debug mode.
Enter Debug Mode executed ok
Preparing target to test port 10
Initial conditions for port 10 speed = 3, width = 8
Monitoring down stream component errors at offsets 0x104 and 0x110
Starting test
Test finished on port 10
+——–+———–+———–+———–+———–+———–+
| | x1 | x2 | x4 | x8 | x16 |
+——–+———–+———–+———–+———–+———–+
| Gen1 | 0 | 0 | 0 | 500 | 0 |
+——–+———–+———–+———–+———–+———–+
| Gen2 | 0 | 0 | 0 | 0 | 0 |
+——–+———–+———–+———–+———–+———–+
| Gen3 | 0 | 0 | 0 | 500 | 0 |
+——–+———–+———–+———–+———–+———–+
Speed errors 0
Width errors 0
No train 0
Uncorrectable errors 0
Correctable errors 0
DSC Uncorrectable errors 0
DSC Correctable errors 0
Time for test: 821.27 seconds.
Done, exiting debug mode.
Session Finished!
If time is of the essence, an optimized version, that doesn’t check for downstream component (DSC) errors during every loop, but rather checks the error register at the end, runs as follows:
root@bmc:~# ./ltloop -p10 -l1000 -t6
Link Training Loop test
Library version = 0.21.11 (base = SKL0.0.5)
Selecting socket 1
Entering debug mode.
Enter Debug Mode executed ok
Preparing target to test port 10
Initial conditions for port 10 speed = 3, width = 8
Starting test
Test finished on port 10
+——–+———–+———–+———–+———–+———–+
| | x1 | x2 | x4 | x8 | x16 |
+——–+———–+———–+———–+———–+———–+
| Gen1 | 0 | 0 | 0 | 500 | 0 |
+——–+———–+———–+———–+———–+———–+
| Gen2 | 0 | 0 | 0 | 0 | 0 |
+——–+———–+———–+———–+———–+———–+
| Gen3 | 0 | 0 | 0 | 500 | 0 |
+——–+———–+———–+———–+———–+———–+
Speed errors 0
Width errors 0
No train 0
Uncorrectable errors 0
Correctable errors 0
Time for test: 151.62 seconds.
Done, exiting debug mode.
Session Finished!
Optimizations can be performed to speed up the testing time if this routine is used for POST and the boot time needs to be minimized. On the benchtop, it is not unusual to run for 1,000 iterations, or even 10,000 or 100,000, to track down extremely intermittent errors. In particular, the checking of the downstream component (DSC) error register incurs a lot of overhead, and can be done at the end, as opposed to every iteration. As can be seen from the console files above, the average loop time changes from 0.82 seconds with DSC error checking enabled, down to 0.15 seconds with the DSC error checking simply performed at the end.
Alternatively, if the application indeed needs to run for 100,000 loops, think about running this at-scale; that is, on many systems simultaneously. This is where the power of BIST and OTD come in. You can either run the test 100,000 times on one system, or 10,000 on ten systems, or 1,000 times on 100 systems. If the problem is truly a needle in a haystack type of issue, testing at scale might mean the difference between discovering root cause in hours instead of weeks.
What does this mean in real life? ASSET did a set of benchmarks of this OTD speed/retrain test versus a competitive at-scale debug solution versus an equivalent benchtop solution:
With a benchtop ITP solution, 100,000 retrain loops would take 16,000 seconds, or four hours and 27 minutes.
With an At-Scale Debug (remote host + target) solution, this would take 60,000 seconds, or 16 hours and 40 minutes.
You can see that ASSET’s OTD runs marginally faster than the benchtop ITP. So you could run that 100,000 retrain loop test on one system for four hours and 10 minutes. Or, if ten systems were available in a lab, total test time would be 25 minutes. With 100 systems, two minutes, 30 seconds. So, the truly at-scale nature of ASSET’s solution is unparalleled. We're delighted to be able to deliver an OTD that operates faster even than a benchtop solution, despite the much slower performance of a BMC versus a remote Windows-based workstation.
When some possible signature of system issues is identified with lt_loop(), more sophisticated benchtop tools can be brought to bear to nail down root cause. You can think of lt_loop() perhaps as an at-scale pass/fail test that can be quickly brought to bear on hundreds of systems simultaneously. This reduces the time to identify problems with reference clock quality, signal voltage levels, how devices are connected to the host, add-in card or device firmware/driver versions, etc. etc. Afterwards, benchtop tools like a PCI Express logic analyzer and SourcePoint can be used to isolate root cause.
For more information on the at-scale capabilities of ASSET BIST offerings, read our technical overview on ScanWorks Embedded Diagnostics (note: requires registration).


