In the article JTAG and run-control API in BMCs for at-scale debug, I described how embedding the Intel ITP run-control library down on a service processor provides for a rich set of target-based functions for debug forensics. How might this apply to reading MSRs, such as the ones created to address Spectre and Meltdown?
The two general categories of vulnerabilities involving processor speculative execution, ominously named Spectre and Meltdown, have received a lot of media attention lately. Speculative execution allows CPUs to perform some functions ahead of time, speeding up routine tasks. The problem with speculative execution is that it introduces vulnerabilities that, at least in principle and as an example, allows hackers to retrieve kernel data that user applications normally would not have access to.
As of the time of this writing, there have been numerous malware samples exploiting these vulnerabilities found in the wild (http://www.tomshardware.com/news/meltdown-spectre-malware-found-fortinet,36439.html). And the status of microcode patches and their impact on performance is still unstable and a work-in-progress; there is some level of performance hit, and it can take some time for OS and system vendors to deliver the needed patches; and some platforms, especially older ones, may never receive them. Patches have been applied and then pulled back based on causing more trouble than what they are worth. But what really fascinates me about the work going on behind the scenes is the use of model specific registers, or MSRs for short, on x86 platforms, to mitigate the threat.
An example of Intel’s plan currently is to have future processors advertise that they control speculative execution by setting a flag called the IBRS_ALL bit. IBRS refers to Indirect Branch Restricted Speculation, one of three new hardware patches Intel is offering as CPU microcode updates, in addition to the mitigation created by Google called retpoline. CPUs need this microcode from Intel to fully mitigate Spectre on Intel CPUs.
IBRS, along with Single Thread Indirect Branch Predictors (STIBP) and Indirect Branch Predictor Barrier (IBPB), prevent a potential attacker or malware from abusing branch prediction to read memory it shouldn't – such as passwords or other sensitive information out of protected kernel memory.
A fascinating and in-depth description of these flags can be found in the Linux Kernel Mailing List, at https://patchwork.kernel.org/patch/10145335/. Some of these flags are described as follows:
cpuid ax=0x7, return rdx bit 26 to indicate presence of this feature
IA32_SPEC_CTRL (0x48) and IA32_PRED_CMD (0x49)
IA32_SPEC_CTRL, bit0 – Indirect Branch Restricted Speculation (IBRS)
IA32_PRED_CMD, bit0 – Indirect Branch Prediction Barrier (IBPB)
If IBRS is set, near returns and near indirect jumps/calls will not allow their predicted target address to be controlled by code that executed in a less privileged prediction mode before the IBRS mode was last written with a value of 1 or on another logical processor so long as all RSB entries from the previous less privileged prediction mode are overwritten.
Setting of IBPB ensures that earlier code's behavior does not control later indirect branch predictions. It is used when context switching to new untrusted address space. Unlike IBRS, it is a command MSR and does not retain its state.
* Thus a near indirect jump/call/return may be affected by code in a less privileged prediction mode that executed AFTER IBRS mode was last written with a value of 1.
* There is no need to clear IBRS before writing it with a value of 1. Unconditionally writing it with a value of 1 after the prediction mode change is sufficient.
As of the time of writing, the status of these microcode updates is unclear; BIOS updates have been issued instantiating the MSRs and patching microcode, and then been revoked. Some Intel Core and Xeon platforms have been updated and some have not. And the vulnerability goes back in time to Intel Sandy Bridge processors and earlier.
It would be interesting to observe, for example, the toggling of IBPB (MSR x’49’ bit 0) on a server in a meaningful code execution context. You would want to do this at a hardware level and below the level of the OS or VM, using either JTAG, or, if you didn’t need the code context, PECI.
JTAG could of course be the preferred method, as it allows execution of run-control functions (to view code execution, set breakpoints, single-step through code, etc.) combined with trace (to observe the effects of interrrupts, the Management Engine message flow, and even using Architecture Event Trace (AET) to observe the RDMSR and WRMSR functions). Intel x86 benchtop debuggers like ASSET’s SourcePoint product are ideal for such observations.
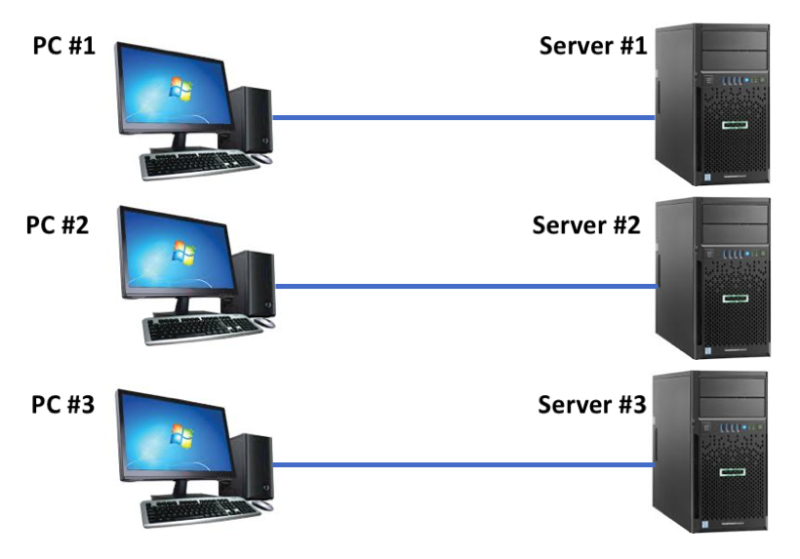
The challenge of the benchtop debuggers is that they typically have a 1-to-1 relationship between the debugging application on a PC, and the target. One server needs one PC with the debugger; two servers need two PCs and emulators; and so on. For a large scale observation of system behavior, “PC pollution” results with numerous PCs needed to debug and trace numerous targets.
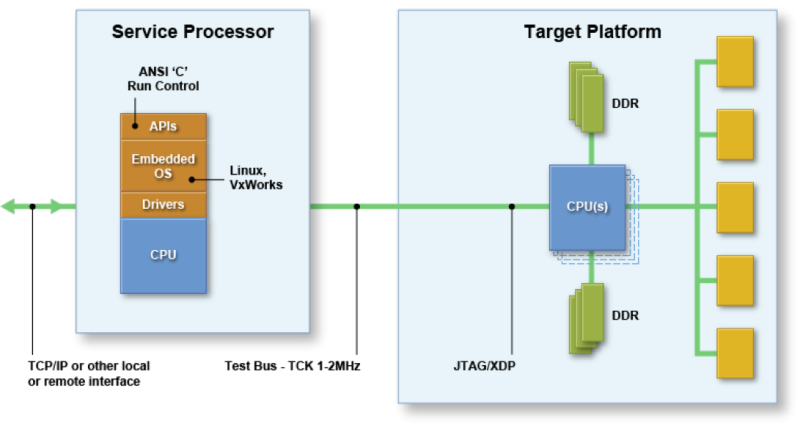
But, if the debugging agent is embedded within the server, as with ASSET’s ScanWorks Embedded Diagnostics (SED) solution, there are no PCs required. This results in a truly “at-scale debug” (ASD) solution:
Imagine having an embedded debug agent able to trace code execution as well as trigger on MSR reads and writes in real-time down on the target, with no external intervention from cables, hardware probes, or other intrusive effects. This is the promise of SED. Read more about the technology in our SED Technical Overview (note: requires registration).


