Truly at-scale debugging requires both JTAG Master and run-control functions to be embedded within server BMCs. Why is this true, and what extra capabilities become available?
In the article Microsoft Project Olympus Schematics and Embedded JTAG Run-Control, we covered Microsoft Azure’s hardware design disclosure of the JTAG and sideband (PREQ, PRDY, etc.) signals necessary for in-situ hardware-assisted debug. In last week’s JTAG Master function for embedded debug and test, we delved into the specifics of having a high-performance JTAG Master burned into BMC silicon. Since BMCs typically provide very constrained environments (low in performance, RAM, etc.), it is important to have an optimized hardware Master within the silicon, as well as tuned drivers to operate it.
Beyond the JTAG Master, the other main component of any at-scale debugging solution is the run-control library. Written in ‘C’, the run-control library provides the API to program the interface at an x86 architectural level, as opposed to solely at the JTAG state move and instruction register/data register scan level. Examples of JTAG low-level functions might be, for example, SetTAPState() and ScanDR(). Examples of higher-level run-control library functions are EnterDebugMode(), ReadGPR(), and WriteIO().
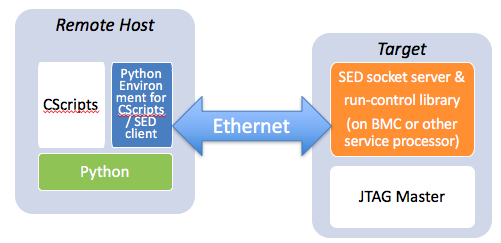
For interactive debug, there is a separate remote host that communicates with the BMC, and supports the Python CLI and Intel CScripts environment:
Interactive debug over Ethernet is fine for running CScripts, but true at-scale debug requires diagnostics to be directly down on the target. Platform audits, very commonly used on high-availability systems, need to be performed independent of any network connection back to a remote host. Also, high-performance applications are run locally on the target, independent of the latency associated with long round-trip communications to the remote host. An example of an embedded application that runs as a diagnostic audit might be one that periodically stresses the PCI Express Link Training & Status State Machine (LTSSM), as covered in my blog Using Embedded Run-Control for PCIe Link Training Testing.
ASSET implements in-situ diagnostics via direct support of the x86 run-control API down on the target. The run-control API are synonymous with lower-level Intel In-Target Probe (ITP) procedures. Some of the functions and their descriptions are below:
- ai_IsPowerOn()
Function Purpose:
This function checks that that target is powered up. The check is done by evaluating the level on the HOOK0 (PWRGOOD) pin of the XDP interface.
XDP Pins used/exercised:
HOOK0 (PWRGOOD)
- ai_ReturnIDCode()
Function Purpose:
This function returns the TAP IDCODE from the currently targeted core. It makes use of the JTAG lines only (TCK, TMS, TRST, TDI and TDO). Upon successful completion the function should return 0, with the IDCode parameter containing a 32 bit value.
XDP Pins used/exercised:
HOOK0 (PWRGOOD), TCK, TMS, TRST, TDI and TDO.
- ai_EnterDebugMode()
Function Purpose:
ThIs function attempts to halt the CPU.
FPGA XDP Pins used/exercised:
HOOK0 (PWRGOOD), TCK, TMS, TRST, TDI, TDO, PREQ#, PRDY#
Note:
Although PRDY# should pulse in response to debug mode entry commands, the function itself does not make any use of the PRDY pulse. Debug mode entry confirmation is done via execution of JTAG commands.
- ai_ReadGPR()
Function Purpose:
ThIs function attempts to read from a General Purpose Register (GPR). This function requires the CPU to be in debug mode. Debug Mode entry is automatically requested prior to the function carrying out commands to retrieve the GPR(s).
XDP Pins used/exercised:
HOOK0 (PWRGOOD), TCK, TMS, TRST, TDI, TDO, PREQ#, PRDY#
Of course, this is only a small subset of the API available. Intel ITP run-control allows access to all x86 architecturally visible registers, memory and I/O; setting and getting of breakpoints; single-stepping through code; and download and execution of user-written diagnostics. Some data can even be retrieved from the system in the case of a hard hang, where the system is wedged and not responsive to probe mode. Users of ASSET’s ScanWorks Embedded Diagnostics (SED) get complete access to collateral with all function descriptions, parameters, return codes, error codes, and sample code with documentation.
Writing applications that use run-control natively and run down on the BMC is very easy. These can then be downloaded to the BMC, or made resident in its flash memory, and be invoked at-will, at-scale, to troubleshoot bugs. It is even possible for the BMC to instantiate small diagnostic applications in RAM or Cache-As-RAM, using the ai_DownloadUserDiag() and ai_ExecuteUserDiag() functions.
As can be seen, these utilities are very powerful, and detailed documentation along with turnkey services and support are available from ASSET to help with your implementation. At-scale debug infrastructure is now available on all Microsoft Azure Project Olympus servers, and many other server platforms. Want to know more? Please register for our free eBook, SED Technical Overview.


