This is getting pretty intense. It’s time to explore the code that executes at the reset vector, and see the printf messages coming out of the BIOS as the Minnowboard boots.
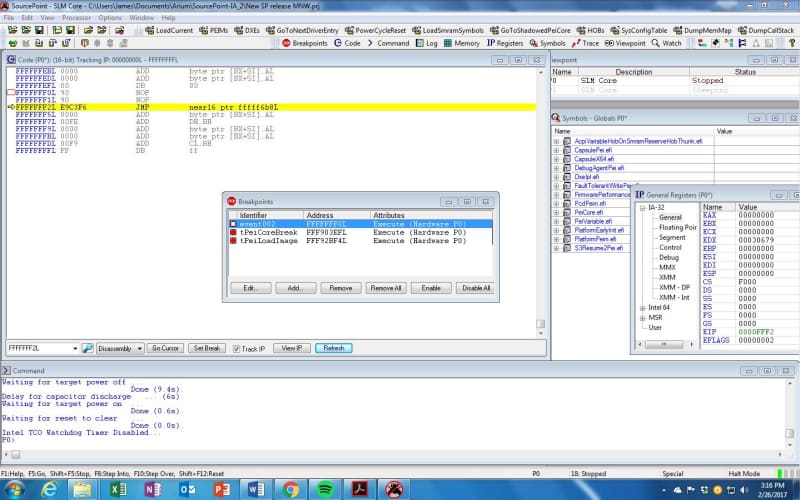
Having gotten past my reset issues on the Minnowboard, I set a hard breakpoint directly at the reset vector (which is at physical address FFFFFFF0h on the Minnowboard). The reset vector is the default location (address) where the BayTrail CPU finds the first instruction it will execute after a reset. You can see these first instructions in the SourcePoint debugger Code window:
There are a couple of NOP instructions, followed by a near JMP to address FFFFF6B8. Everything is in assembly language because the initial code is being executed out of flash memory. Looking at the code at FFFFF6B8 is informative.
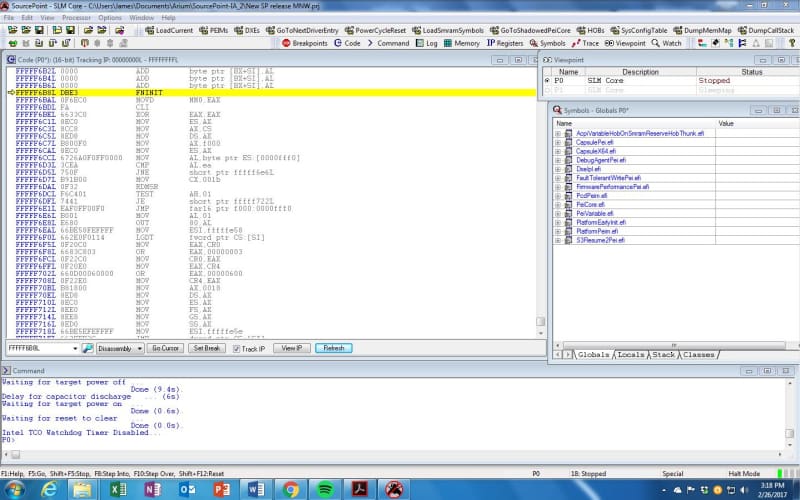
The first instruction there is FPINIT, which initializes the processor floating point unit (FPU). Then there is some more assembly language code, which I will have to determine the meaning of later. It’s a good time to load the PEI modules and try to see some source code somewhere, by clicking on the PEIMs button at the top of the screen. An excerpt of the output within the Command window looks like this:
P0>LoadPeims
PlatformEarlyInit Entry: FFF203A0L Base: FFF20140L "c:\myworkspace\Build\Vlv2TbltDevicePkg\DEBUG_VS2012x86\IA32\Vlv2TbltDevicePkg\PlatformInitPei\PlatformInitPei\DEBUG\PlatformEarlyInit.efi"
PchSmbusArpDisabled Entry: FFF29C20L Base: FFF299C0L FILE NOT FOUND "m:\Build\Vlv2TbltDevicePkg\DEBUG_VS2008x86\IA32\Vlv2DeviceRefCodePkg\ValleyView2Soc\SouthCluster\Smbus\Pei\PchSmbusArpDisabled\DEBUG\PchSmbusArpDisabled.pdb"
VlvInitPeim Entry: FFF2B820L Base: FFF2B5C0L FILE NOT FOUND "m:\Build\Vlv2TbltDevicePkg\DEBUG_VS2008x86\IA32\Vlv2DeviceRefCodePkg\ValleyView2Soc\NorthCluster\VlvInit\Pei\VlvInitPeim\DEBUG\VlvInitPeim.pdb"
PchInitPeim Entry: FFF2DA00L Base: FFF2D7A0L FILE NOT FOUND "m:\Build\Vlv2TbltDevicePkg\DEBUG_VS2008x86\IA32\Vlv2DeviceRefCodePkg\ValleyView2Soc\SouthCluster\PchInit\Pei\PchInitPeim\DEBUG\PchInitPeim.pdb"
PchSpiPeim Entry: FFF33280L Base: FFF33020L FILE NOT FOUND "m:\Build\Vlv2TbltDevicePkg\DEBUG_VS2008x86\IA32\Vlv2DeviceRefCodePkg\ValleyView2Soc\SouthCluster\Spi\Pei\PchSpiPeim\DEBUG\PchSpiPeim.pdb"
PeiSmmAccess Entry: FFF35880L Base: FFF35620L FILE NOT FOUND "m:\Build\Vlv2TbltDevicePkg\DEBUG_VS2008x86\IA32\Vlv2DeviceRefCodePkg\ValleyView2Soc\CPU\SmmAccess\Pei\SmmAccess\DEBUG\PeiSmmAccess.pdb"
PeiSmmControl Entry: FFF37000L Base: FFF36DA0L FILE NOT FOUND "m:\Build\Vlv2TbltDevicePkg\DEBUG_VS2008x86\IA32\Vlv2DeviceRefCodePkg\ValleyView2Soc\SouthCluster\SmmControl\Pei\SmmControl\DEBUG\PeiSmmControl.pdb"
S3Resume2Pei Entry: FFF38280L Base: FFF38020L "c:\myworkspace\Build\Vlv2TbltDevicePkg\DEBUG_VS2012x86\IA32\UefiCpuPkg\Universal\Acpi\S3Resume2Pei\S3Resume2Pei\DEBUG\S3Resume2Pei.efi"
A number of the modules cannot be found. But for those that are, there are handy pointers to the source build tree and where the .MAP files are. More on this later.
As I prepare to delve even further into the source code involved in the early boot process, the other indispensable aid is to take advantage of the debug printf statements that come out of the serial port of the Minnowboard. I obtained an inexpensive serial-to-USB cable on Amazon, and hooked it up to my Mac using the CoolTerm application. That is when things got really exciting: as I booted up the system, I saw some very interesting information come out to the terminal. An excerpt of the first couple of screens are:
>>>>SecStartup
Mono Status Code PEIM Loaded
Install PPI: 1F4C6F90-B06B-48D8-A201-BAE5F1CD7D56
Install PPI: AB294A92-EAF5-4CF3-AB2B-2D4BED4DB63D
Register PPI Notify: F894643D-C449-42D1-8EA8-85BDD8C65BDE
DetermineTurbotBoard() Entry
MmioConf0[0xFED0E200], MmioPadval[0xFED0E208]
Gpio_S5_4 value is 0x3
Gpio_S5_17 value is 0x3
GGC: 0x00000210 GMSsize:0x00000002
CheckCfioPnpSettings: CFIO Pnp Settings Disabled
DetermineTurbotBoard() Entry
MmioConf0[0xFED0E200], MmioPadval[0xFED0E208]
Gpio_S5_4 value is 0x3
Gpio_S5_17 value is 0x3
Setting BootMode to BOOT_WITH_FULL_CONFIGURATION
Setup MMIO size …
Install PPI: E767BF7F-4DB6-5B34-1011-4FBE4CA7AFD2
PROGRESS CODE: V3020003 I0
PDB = m:\Build\Vlv2TbltDevicePkg\DEBUG_VS2008x86\IA32\Vlv2DeviceRefCodePkg\Txe\SeCUma\SeCUmaPeim\DEBUG\SeCUma.pdb
Loading PEIM at 0x000FFFA2E20 EntryPoint=0x000FFFA3080 SeCUma.efi
PROGRESS CODE: V3020002 I0
Install PPI: CBD86677-362F-4C04-9459-A741326E05CF
Info: SeC PPI load sucessfully
PROGRESS CODE: V3020003 I0
PDB = c:\myworkspace\Build\Vlv2TbltDevicePkg\DEBUG_VS2012x86\IA32\SourceLevelDebugPkg\DebugAgentPei\DebugAgentPei\DEBUG\DebugAgentPei.pdb
Loading PEIM at 0x000FFFA49A0 EntryPoint=0x000FFFA4C00 DebugAgentPei.efi
PROGRESS CODE: V3020002 I0
Install PPI: 3CD652B4-6D33-4DCE-89DB-83DF9766FCCA
Debug Timer: FSB Clock = 200000000
Debug Timer: Divisor = 2
Debug Timer: Frequency = 100000000
Debug Timer: InitialCount = 10000000
Register PPI Notify: F894643D-C449-42D1-8EA8-85BDD8C65BDE
Set MRC paramaters for MinnowBoard Max.
MmioConf0[0xFED0E220], MmioPadval[0xFED0E228]
Gpio_S5_5 value is 0x3
Determine the memory size is [2GB]
DRAM_Speed is 1066MHz!
DRAM_Speed is type 1, EccEnabled = 0
tCL = 7
tRP_tRCD = 7
tWR = 8
tWTR = 5
tRRD = 6
tRTP = 4
tFAW = 28
PROGRESS CODE: V51001 I0
POSTCODE=<0024>
fastboot
MRC getting memory size from SeC …
SeC Device ID: F18
SeC UMA Size Requested: 16384 KB
MRC SeCUmaSize memory size from SeC … 10
MRC getting fTPM memory size from SeC …
MRC SeCfTPMUmaSize memory size from SeC … 0
PROGRESS CODE: V51002 I0
POSTCODE=<0025>
PROGRESS CODE: V51003 I0
POSTCODE=<0027>
Configuring Memory…
CheckMicrocodeRevision = 00000906, CpuId = 00030679
####: ConfigureMemory() Entry
Current function is MMRC_Init
Current function is McEnableHPET
Current function is ClearSelfRefresh
Current function is OemTrackInitComplete
Current function is ProgSFRVolSel
Current function is ProgDdrTimingControl
Current function is ProgBunit
Current function is ProgMpllSetup
Current function is ProgStaticDdrSetup
Current function is ProgStaticInitPerf
Current function is ProgStaticPwrClkGating
Current function is DUnitBlMode
Current function is ControlDDR3Reset
Current function is EnableVreg
Current function is ProgHmc
Current function is ProgReadWriteFifoPtr
Current function is ProgComp
Current function is SetIOBUFACT
Current function is ProgDdecodeBeforeJedec
Current function is PerformDDR3Reset
Current function is PreJedecInit
Current function is PerformJedecInit
Current function is SetDDRInitializationComplete
Current function is DisableRank2RankSwitching
Current function is MMRC_RcvnRestore
Current function is MMRC_WrLvlRestore
Current function is MMRC_RdTrainRestore
Current function is MMRC_PerformanceSetting
Current function is MMRC_PowerGatingSetting
Current function is MMRC_SearchRmt
START_RMT:
. RxDqLeft RxDqRight RxVLow RxVHigh TxDqLeft TxDqRight CmdLeft CmdRight
————————————————————————————————
Channel 0 Rank 0 . -20 18 -23 17 -26 23 0 0
STOP_RMT:
CMD module is per channel only and without Rank differentiation
Current function is ProgDraDrb
Current function is ProgMemoryMappingRegisters
Current function is ProgDdrControl
Current function is SetScrambler
Current function is ChangeSelfRefreshSetting
Current function is SetInitDone
Current function is McDisableHPET
Current function is FillOutputStructure
MRC INIT DONE
There is a treasure trove of information here, relating the stages of the boot process, the PEIMs being loaded, and the functions being performed. I’m at the point now where I can start relating all of this activity back to the original source code within the debug build I created with Visual Studio. Then use the SourcePoint debugger to single-step through the code and see its flow. It’s going to get even more exciting from here on in.
Check out Episode 7 and Episode 9 of The Minnowboard Chronicles!


