Initial debug of a new Intel-based design can be much easier using Intel® Customer Scripts (ICS), which are commonly known as CScripts. There are so many facets of checking out an Intel processor-based design today that some basic standard checkout is really needed. Intel Customer Scripts fill this need. One outcome of running them could inform the engineer that the board is relatively functional. However, a more common early result is to show that a portion of the board’s hardware or a segment of its firmware is not working.
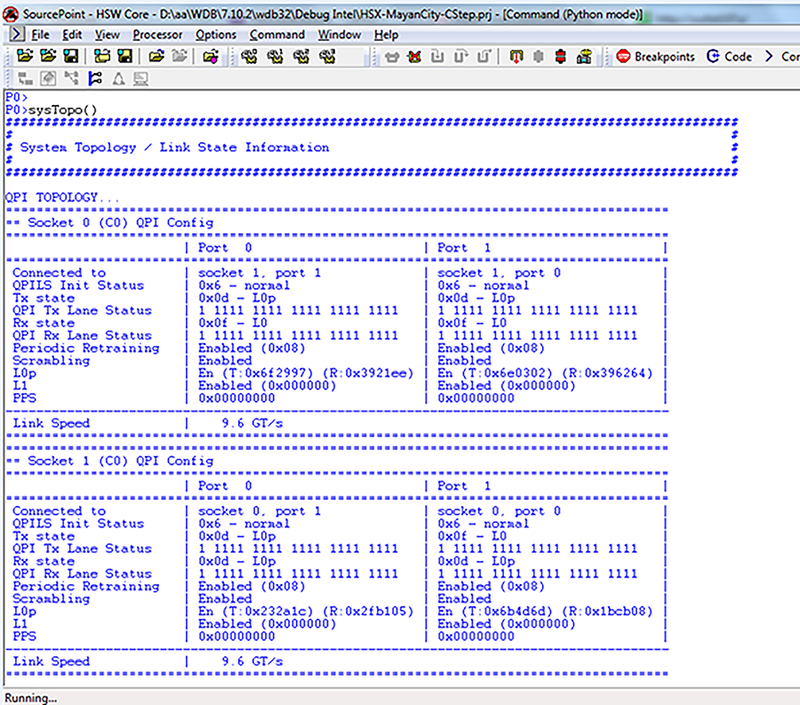
When a feature on a new motherboard is not working, the first thing to do is to compare the configuration (set up by BIOS) to that of an Intel reference platform. There is no way that this is nearly as quick or complete as comparing the output of ICS’s sysTopo() or sysStatus() to the same output on the reference platform.
Even when the board appears to be working, there are aspects of the system that need to be tested. One example of this is ECC error correction. The best way to test this without damaging hardware is to use error injection. This is another feature of ICS that is more a requirement than a nice-to-have.
Finally, when the system is up or close to being up and a catastrophic error occurs, which locks up the processor, only ICS will help you identify the cause of the failure.
The following figure shows the first part of a sysTopo() dump:
For a more complete introduction to Intel Customer Scripts, download an eBook on the topic here.


