A leading server OEM is using an embedded implementation of Intel In-Target Probe (ITP) to perform at-scale debugging, without plugging in an external emulator. How does this work?
In a recent Case Study, ASSET documented the experiences of a leading server company, whose customers have very high expectations for system quality, reliability and availability. As such, the ability to quickly triage and root-cause intermittent silicon, hardware, firmware and software bugs is critical.
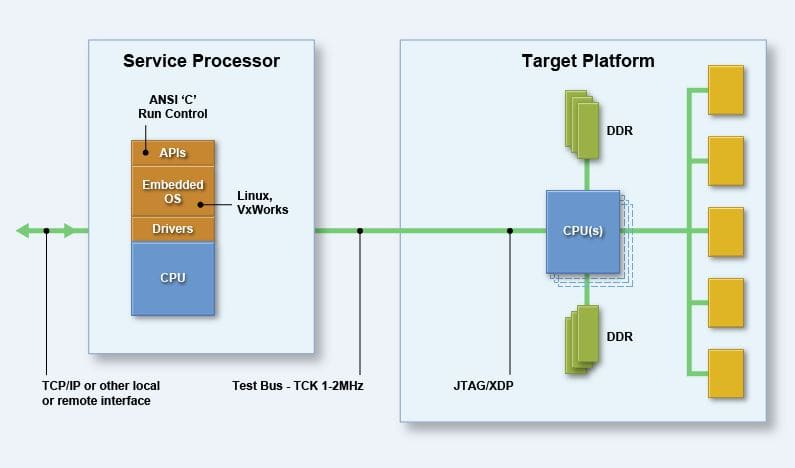
So, they worked with ASSET to embed a version of ITP (also known as XDP) within their system. The topology of the solution looks like this:

In this implementation, the ASSET run-control library and scan engine is embedded within the system’s service processor (such as a Baseboard Management Controller, or BMC). It provides many of the low-level functions of a benchtop debugger, such as register/memory/IO reads/writes, error injection, setting of breakpoints, code instrumentation and debug, etc. etc.
This embedded version of ITP allows them to accomplish the goals of Field Replaceable Unit (FRU) isolation and crash dump collection, for example in the case of a system IERR/CATERR from a processor core three-strike timeout, fatal PCU error or MCERR in SMM mode.
For a generic version of the Case Study, please click on the link High-End Server Company uses ScanWorks Embedded Diagnostics for Global, At-Scale Debugging. For the full report, click on ScanWorks Embedded Diagnostics Case Study. Note that the latter requires both registration and an ASSET NDA.


